

Five case studies from one live education institute
The system on this page is not a theory. It was built and measured on a live education brand first. Here is exactly what was done, what moved, and what is still a gap, stated honestly.

 The institute this was proven on · Visit kwickprep.com
What happened at Kwickprep?
Kwickprep is a live online computer education institute, run by the same LLP as ThinkWithAi. The whole system was built and measured there first: a server rendered site of 161 pages, answer shaped resource pages, one approved set of facts, every AI crawler allowed, and a weekly check on what assistants say. In the 28 days to August 2026 it was named in 78 percent of AI answers to real buying questions.
Whose institute this is. Kwickprep is our own institute, operated by the same LLP that runs GetPreferred. The numbers below are ours, measured on ourselves.
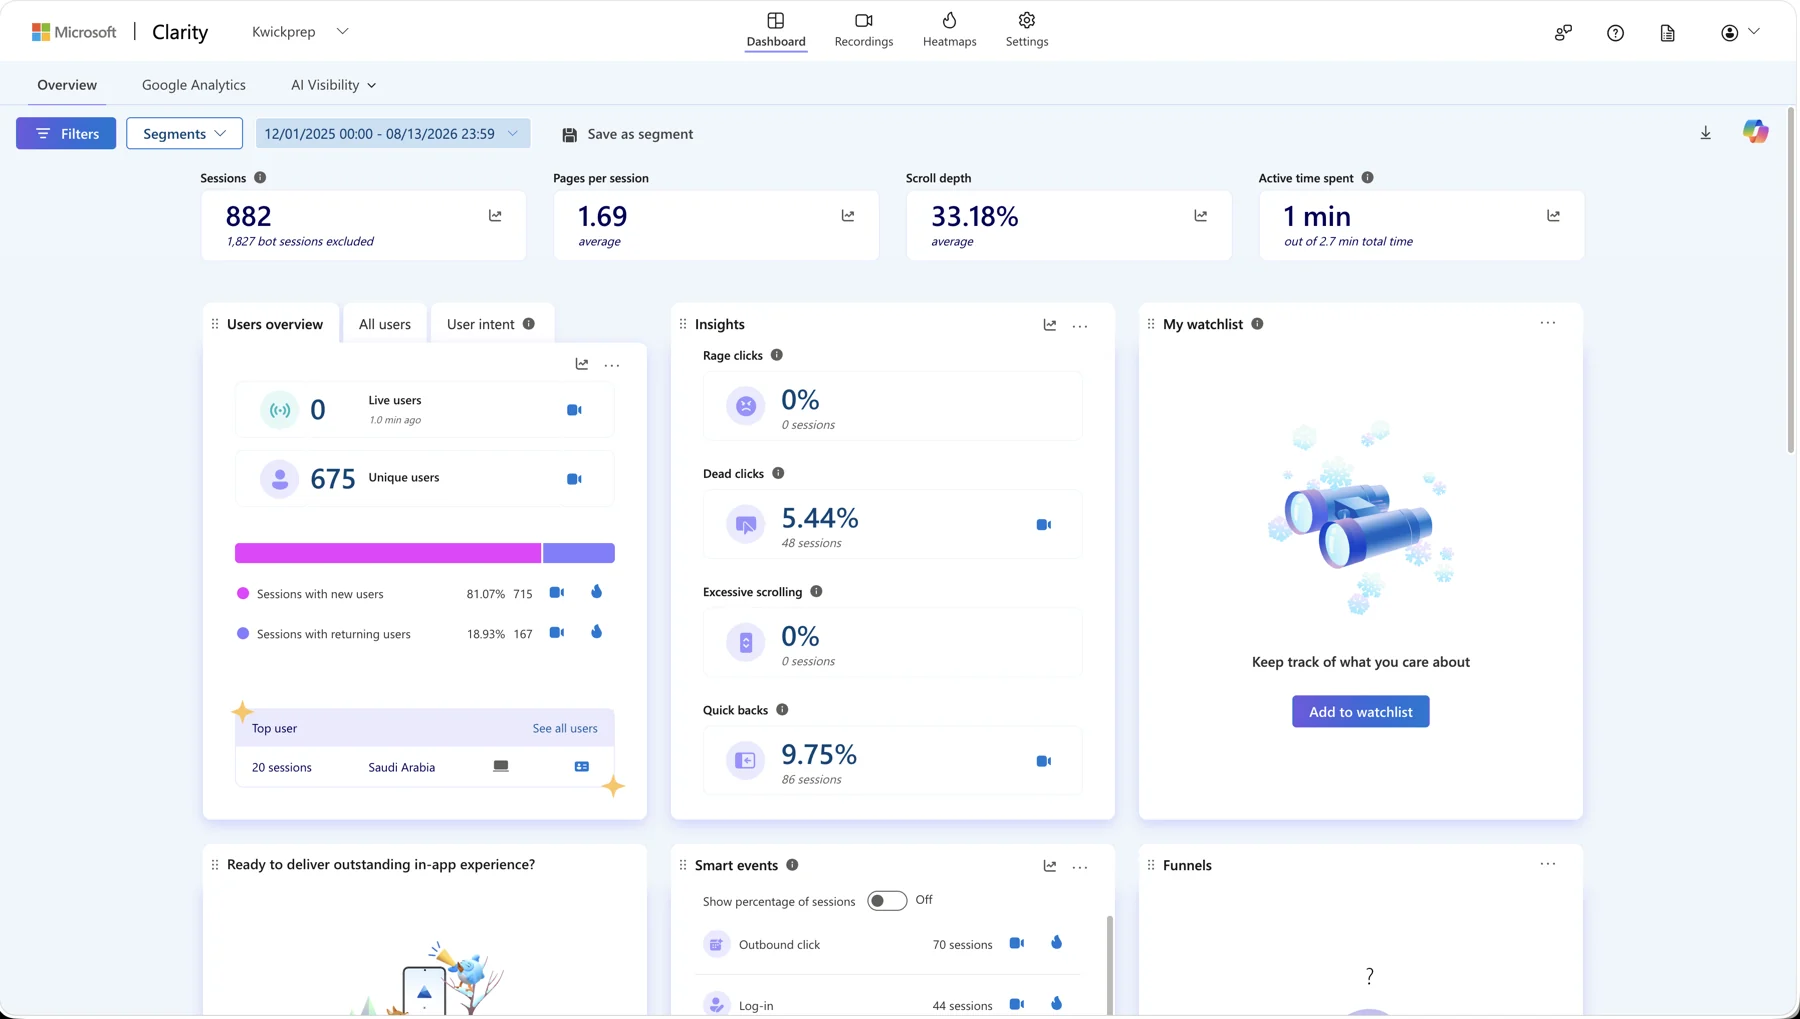
How these numbers are counted. Microsoft Clarity flagged about 56% of raw sessions as bots. Every judgement below is on real humans and money-actions only, which is why the numbers look smaller than a traffic report would. Period: Last 28 days, August 2026. Sources: Google Search Console, Google Analytics 4, Microsoft Clarity, the on-site enquiry events, and an in-house AI visibility tracker.
Is this happening to you right now?
Five things moved. Each has a caveat.
Every figure below is pulled from a live system and dated. Each case prints the honest limitation next to the result, because a case study that only lists wins is an advertisement.
Page one for the queries that actually convert
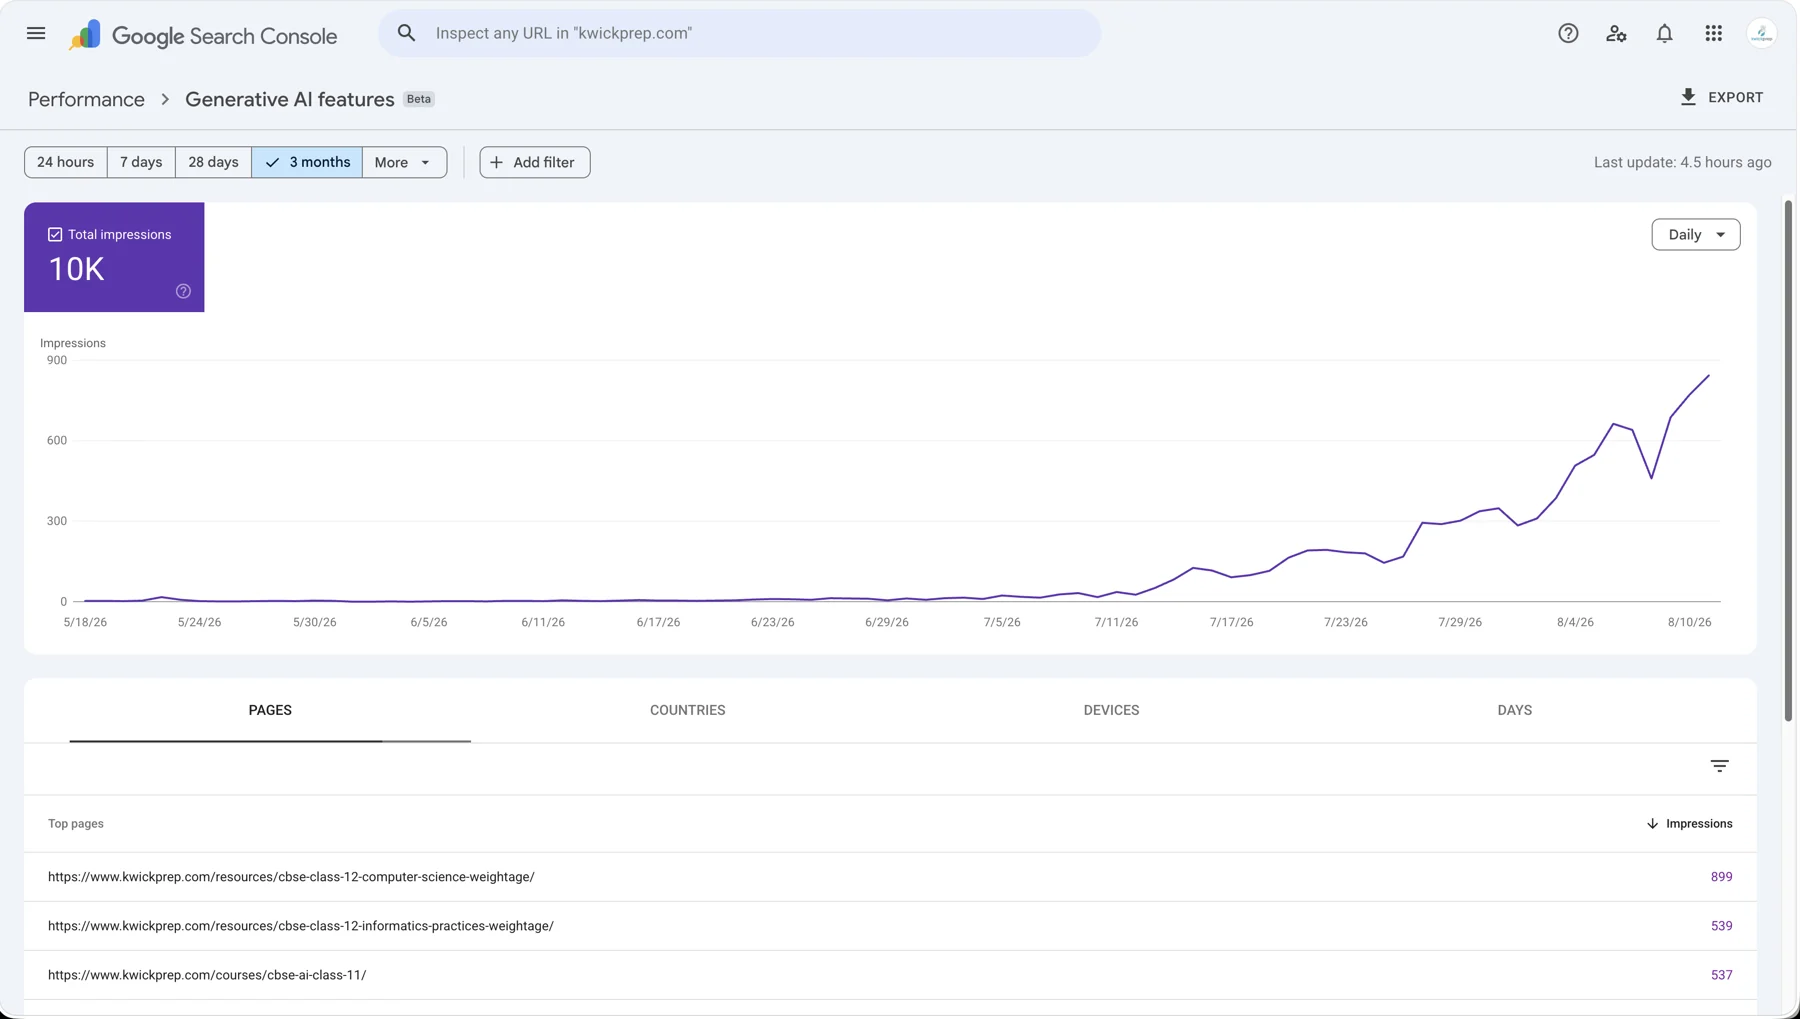
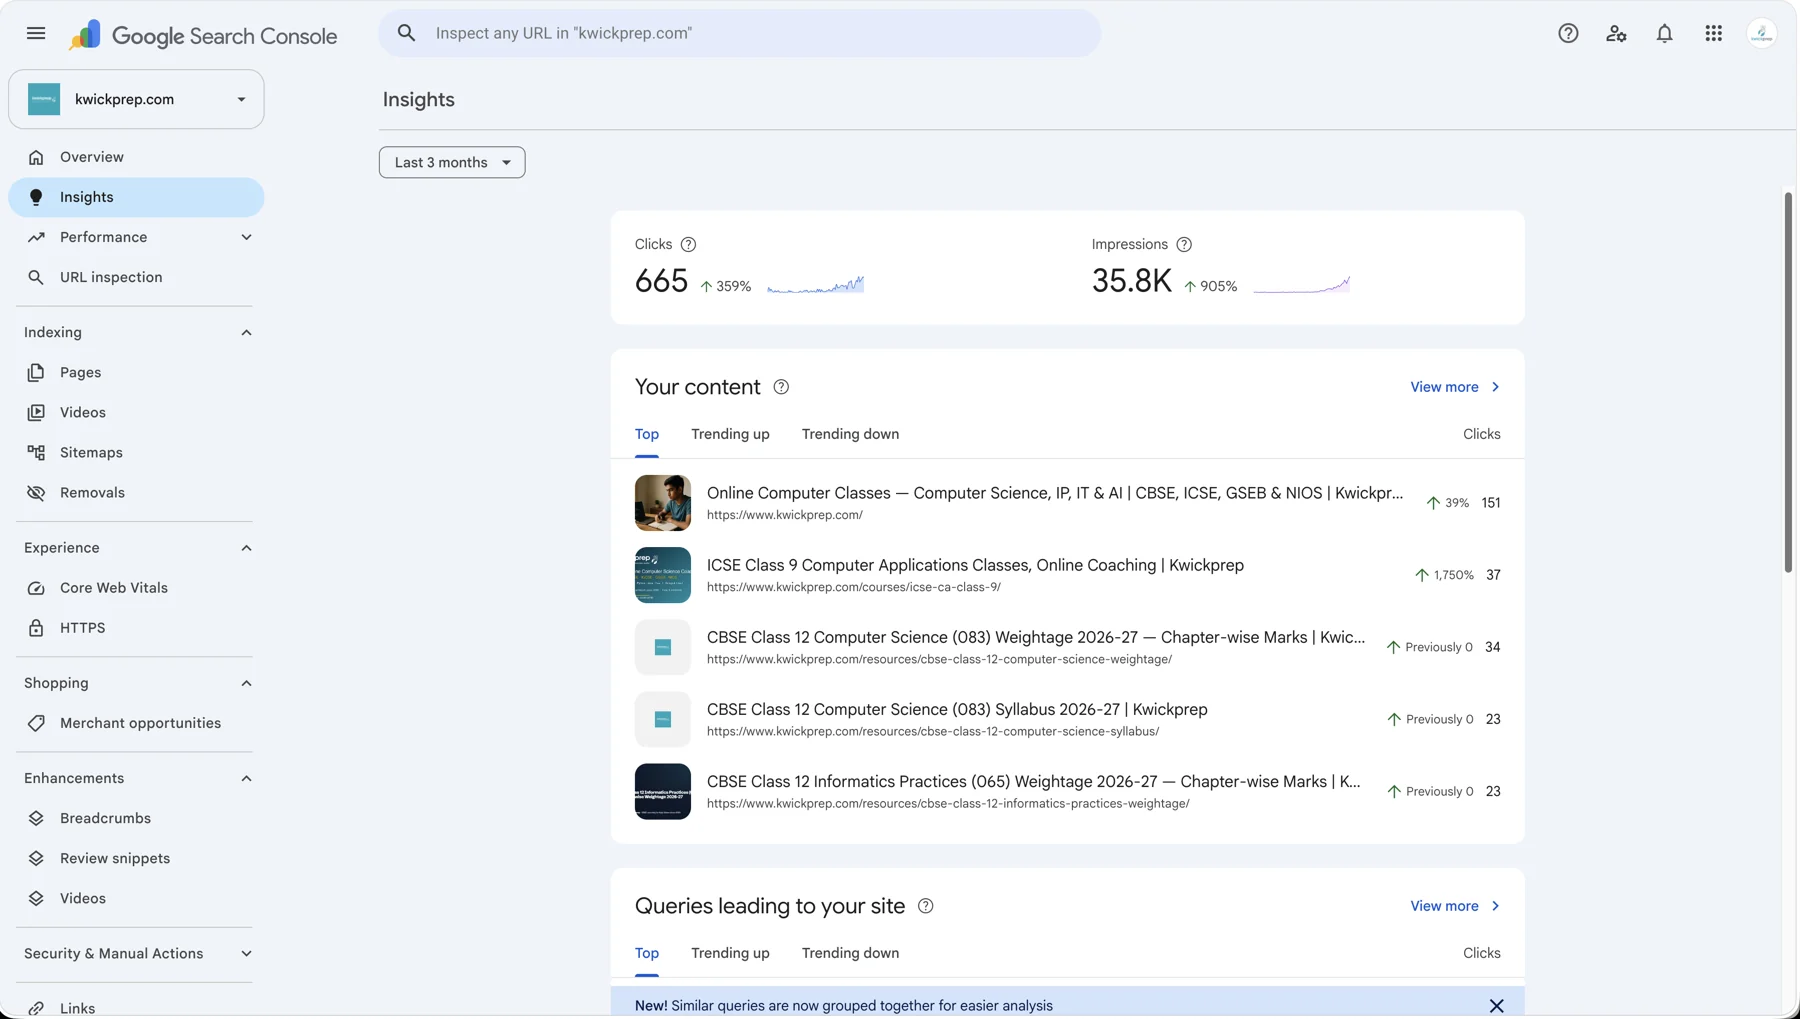
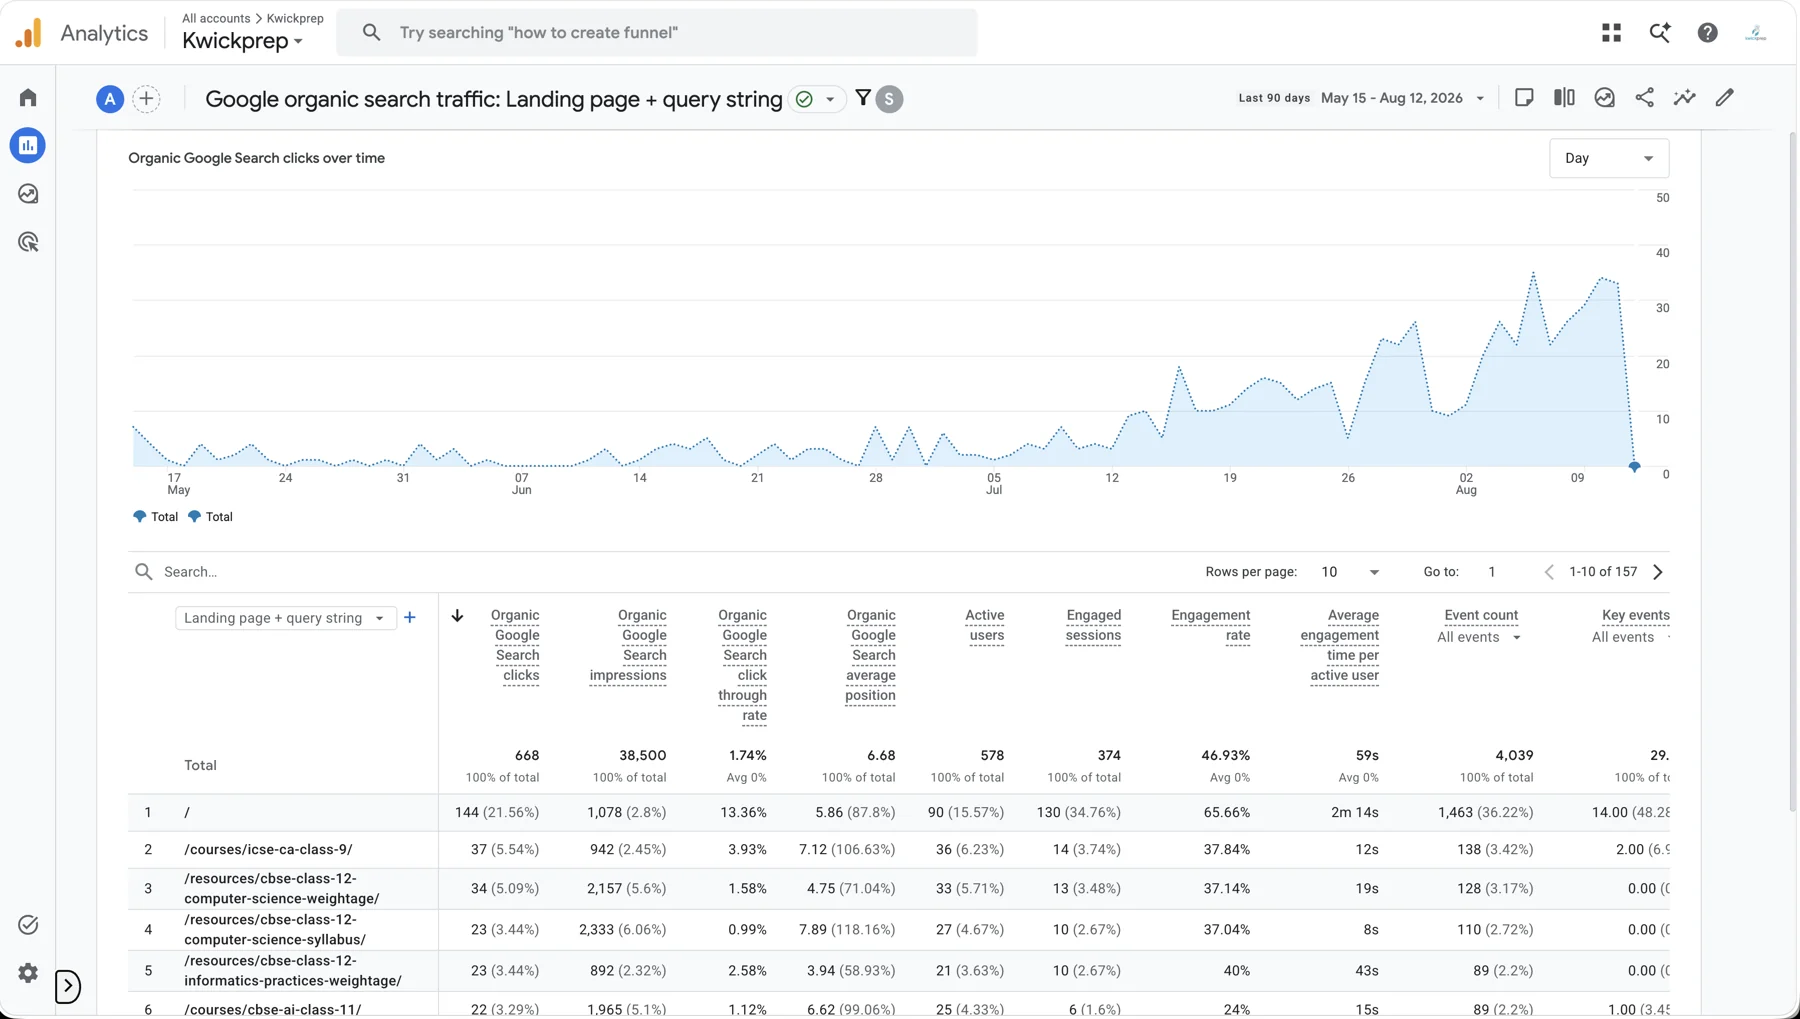
503 clicks · 32,276 impressions · average position 6.7
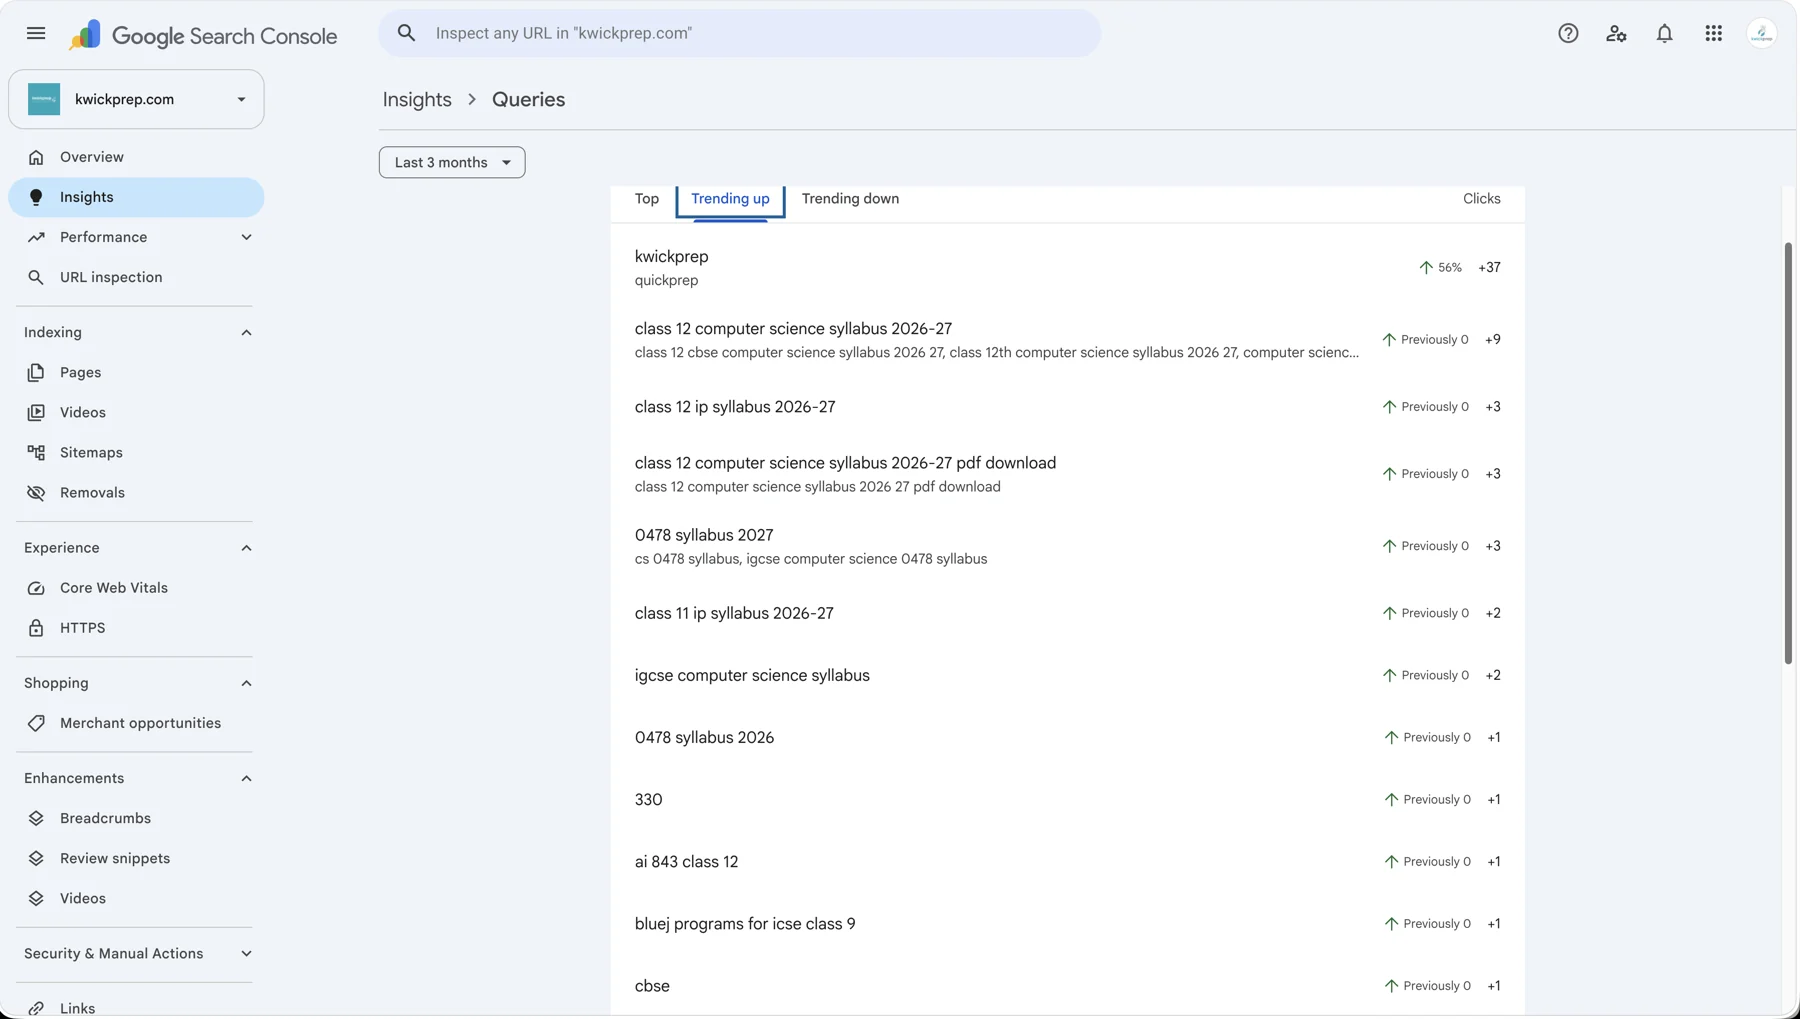
The site is plain server-rendered HTML with no app and no ad budget. Two months earlier it was effectively invisible in Google beyond its own brand name. Instead of chasing the crowded head term, the work built the exact pages a student searches at exam time: syllabus breakdowns, important questions, sample papers.
The winning pages are the free answer and syllabus pages, not the homepage and not the city pages. The queries that win are specific and intent-loaded, such as the Class 12 Computer Science syllabus for the current academic year.
Honest caveat. Click-through rate is 1.6%. The pages rank around position six but are not yet earning the click. That is the next lever, not a success to hide.
Lesson. You win the specific exam query, not the broad category. Broad coaching terms are owned by directories and ads.
Named in 78% of AI answers
ChatGPT 4 of 5 and cited · Gemini 3 of 4 · 66 ChatGPT-referred sessions
The work targeted being quotable rather than ranking: answer-format pages with the brand and academic year in static HTML, rich schema, an plain fact file, every AI crawler explicitly allowed, and Bing plus IndexNow on every deploy, because ChatGPT search leans on Bing.
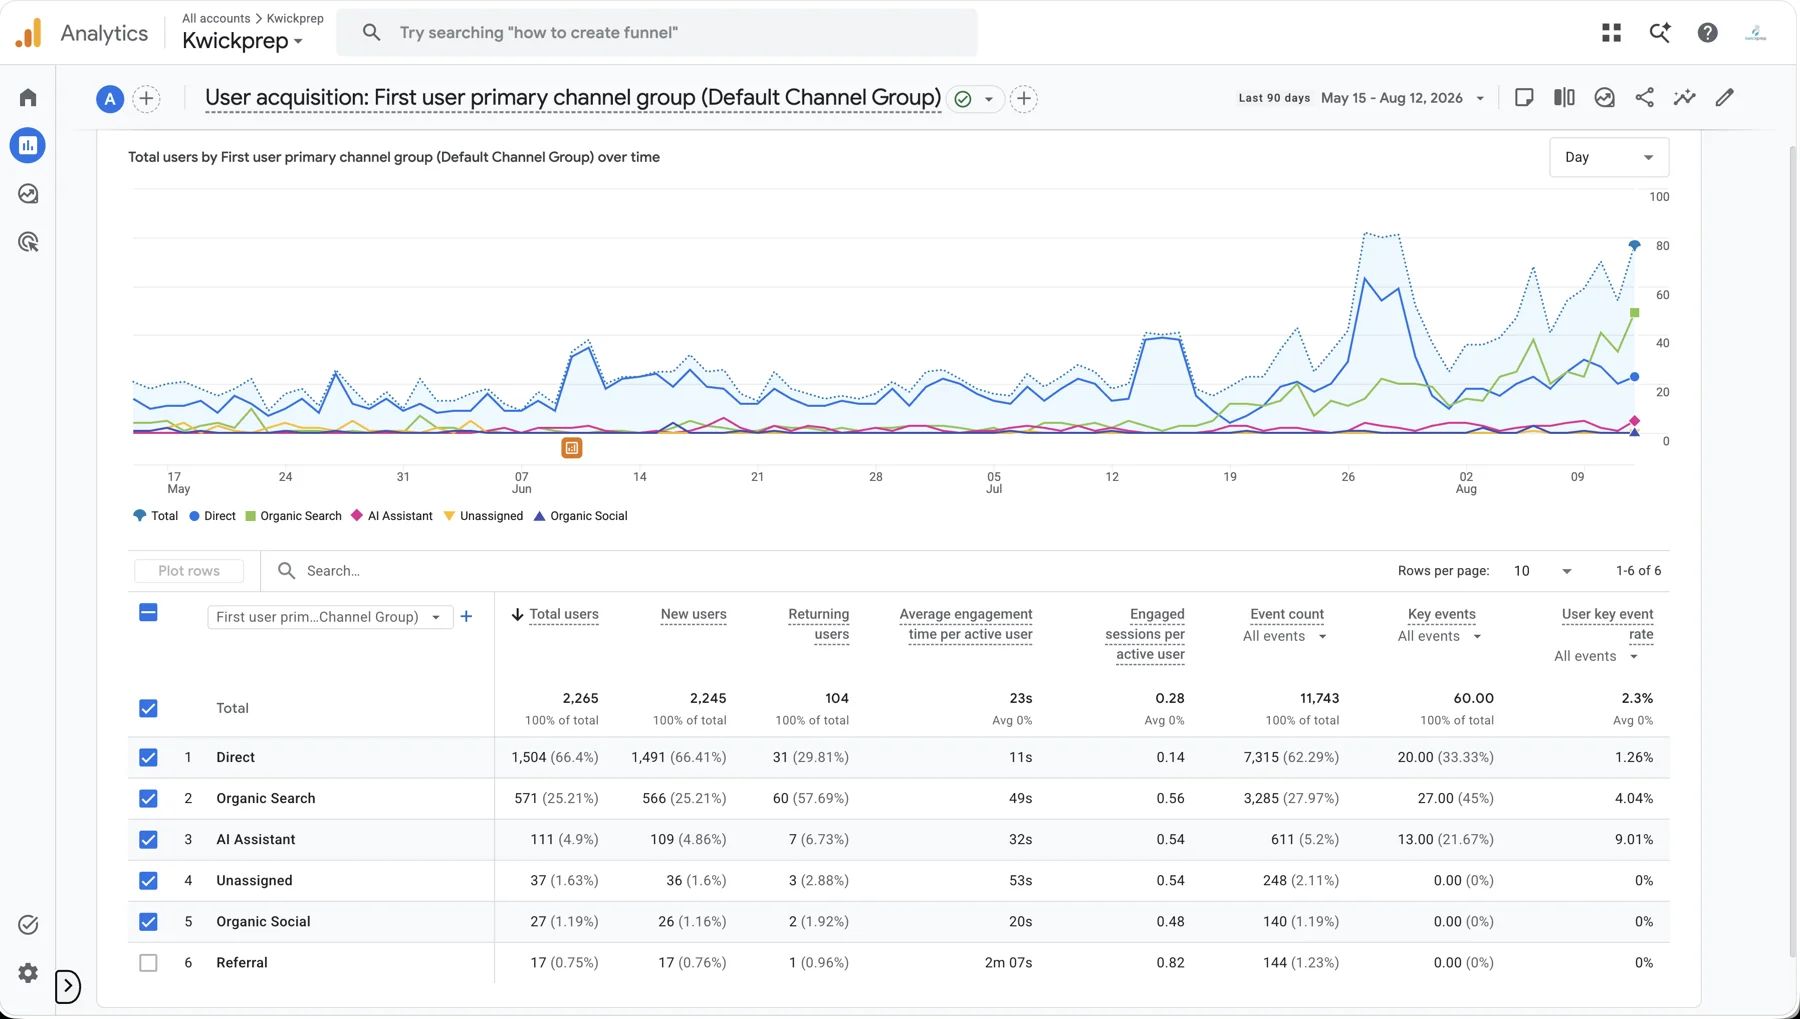
Measured with a purpose-built tracker that runs real buying questions across ChatGPT, Gemini and Claude with web search on. GA4 recorded 66 ChatGPT-referred sessions from 48 visitors in 28 days, essentially the entire AI referral channel.
Honest caveat. This is a nine-answer benchmark, so it is a signal and not a guarantee, and it moves week to week. Referral counts are a floor, not a ceiling, because AI phone apps that strip the referrer land in Direct.
Lesson. Being the source an AI cites is a live, measurable channel that most competitors have not noticed they are losing.
An instant reply beats a good reply tomorrow
15 instant-reply enquiries in 28 days
A parent researching at 10pm does not wait. The talk-to-the-expert button routes to an automated WhatsApp reply that lands the moment someone messages, with no queue and no office hours.
The bot channel accounts for 15 of 41 money-actions, a little over a third, sitting alongside the on-site form, human WhatsApp and phone calls.
Honest caveat. This is one channel of several and the numbers are early. Fifteen clicks in 28 days on a brand that only started seeing real enquiries about two months earlier is a working piece of the funnel, not a finished growth engine.
Lesson. The value is not a clever conversation. It is that nobody who raised their hand is left waiting while they cool off.
From about zero to 41 enquiry actions a month
41 enquiry actions · 19 forms · 3 calls
Every money-action fires an event: form submit, WhatsApp click, call tap, tool lead. Setting aside the 15 bot-routed clicks, that leaves roughly 21 human enquiries and 3 phone calls landing with a real person.
Enquiry actions were essentially zero until about two months earlier. Going from nothing to a steady 41 actions per 28 days is the signal.
Honest caveat. Twenty-one enquiries and three calls in a month is not a headline figure on its own. The trajectory is the story, not the total.
Lesson. Judge progress by enquiries and calls, never by raw traffic. About 56% of that site's raw traffic was bots, and a bot never fills a form.
Most of the traffic was never human
105 real visitors against 333 bots on a single day
A daily operator report pulls the real-versus-bot split from Microsoft Clarity alongside the search and enquiry numbers, so nobody on the team judges a day by raw visits. On 21 July 2026 the site recorded 105 real sessions against 333 bot sessions, which is 76 percent bots.
That same day: 21 real visitors, 2 enquiry actions, 32 sessions and 45 pageviews, with organic search the top source, and Google Search Console showing 11 clicks from 462 impressions at an average position of 6.3. The report also flagged 8 dead clicks, which points at a confusing element rather than a traffic problem.
Honest caveat. A single day is noise, not a trend, and the bot share moves. It is published here because it is the number that stops a team celebrating a traffic spike that never existed, not because one day proves anything.
Lesson. If you do not separate bots from humans, every other number you report is inflated. This is the least impressive chart in the stack and the one that keeps the rest honest.
Not sure whether this applies to you?
The screens these numbers came off
Not a chart we drew. These are the actual consoles, captured from the live accounts on the date shown in each screenshot.
Prefer to talk it through?
Scored honestly, pillar by pillar
This is the internal scorecard, not a sales sheet. The gaps are printed because a case study that only lists wins is an advertisement.
| Pillar | Status | What was actually built | The honest gap |
|---|---|---|---|
| SEO | Strong | Server rendered pages, rich schema, sitemap, Bing and IndexNow auto ping, all 32 course pages deepened with method, careers and reviews | Programmatic scale and a crawl log pipeline |
| AEO | Growing | Answer first important question pages, brand and date rewrites, one approved set of facts plus a drift audit that caught a wrong rating and corrected it across every page | Automatic correction of live AI errors |
| GEO | Early | Off site kit delivered, Google Business Profile and first community answers started | Reviews at scale, digital PR, video and original data. Mostly the owner's move, because a vendor cannot fake trust |
| AIO | Partial | Every AI crawler allowed, AI referral tracking live, fact file maintained | An owned AI surface and model provider relationships |
| Tracking | Built | Weekly AI visibility tracker capturing fan out queries and quoted sentences, plus analytics and a decision dashboard | One unified warehouse and enrolment attribution |
Read it this way. Tracking and SEO lead. GEO is the biggest gap, and it is the one only the institute owner can close, through real reviews, real video and real press. We say that at the start, not in month six.
Curious what it says about your institute?
Want the same baseline for your institute?
We will check what Google and the AI assistants say about you and send you the report. Free, and it arrives within one working week.